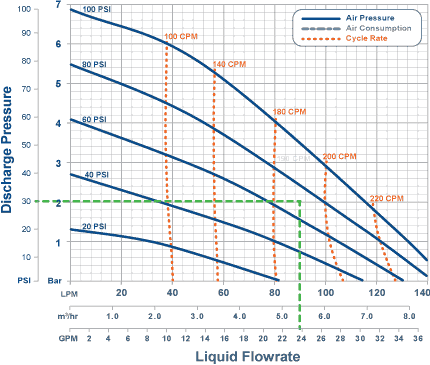

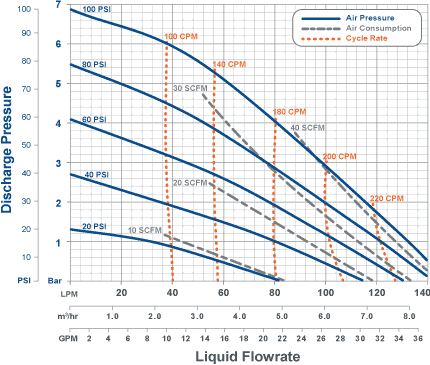
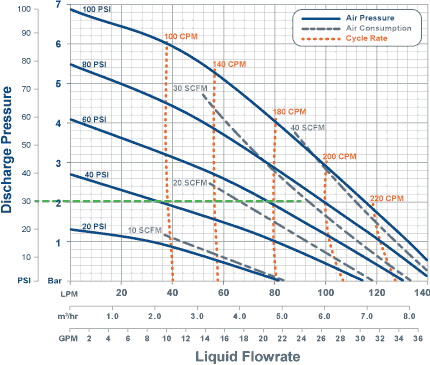
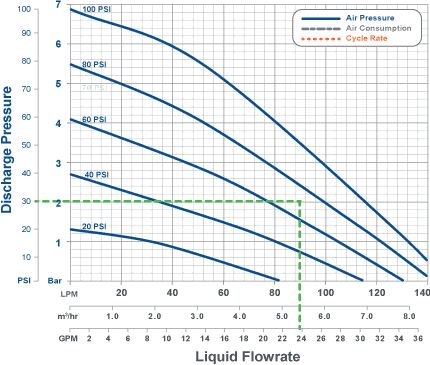
グラフ使用方法
必要な吐出圧を横線及び必要な流量を縦線に引きその交点においてグラフよりエアー消費量及びサイクルレートを算出します。
ステップ1
Draw a horizontal line at your discharge pressure。
(図 30 psi / 2 Bar)
ステップ2
Draw a vertical line at your desired flow rate。
(図 90 lpm / 5.4 m3/hr / 23.8 gpm)
ステップ3
At line intersect, estimate required air pressure.
(図 70 psi / 4.8 Bar)
ステップ4
At line intersect, estimate resultant air consumption。
(図 28 SCFM)
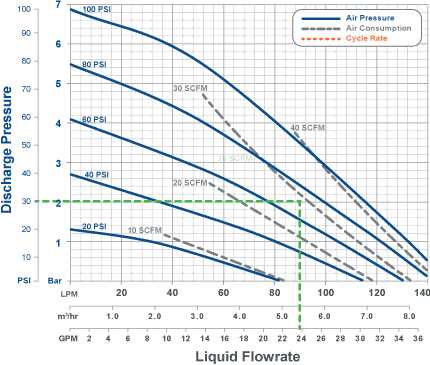
ステップ5
At line intersect, estimate resultant cycle rate。
(図 190 CPM)